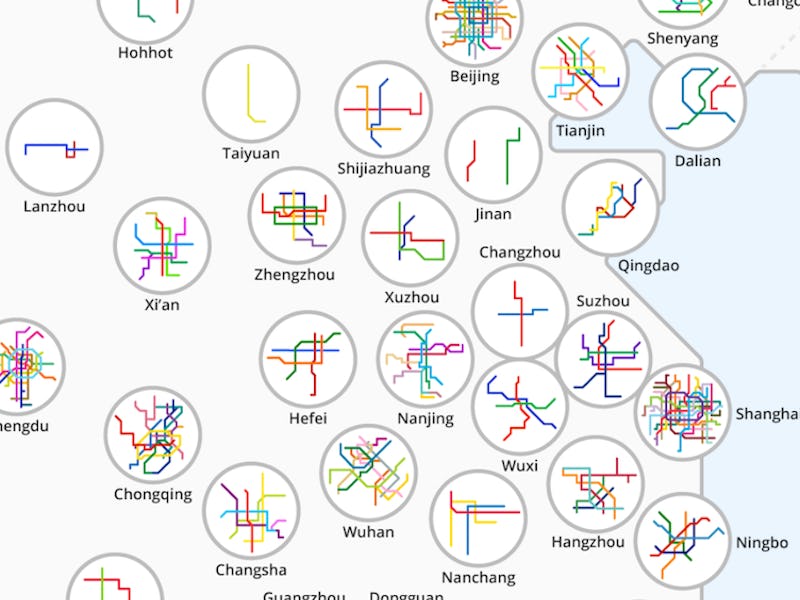
Since 1990, China’s population has continued to grow and, more critically, to urbanize. As millions have left their rural communities for cities, it’s no wonder the country’s metro system has ballooned, too.
But watching the rate of change in graphic designer Peter Dovak’s GIF, which puts 30 years of transportation data on display, makes the development of the past few decades seem all the more mind-boggling.
The boom in China’s metro construction is likely to continue. In 2016, the national government also eased the rules on which cities could build metro projects, in the hopes of accommodating increasing urbanization. Previously, construction had been limited to cities with 3 million people and $1.53 billion in annual revenue.
Thankfully, the above visualization not only includes existing transit options, but forthcoming metro lines, too, as Dovak included project construction stretching through 2020.
Dovak, a train nerd from childhood, grew up in Louisville, Kentucky, which he distinctly remembers as having little in the way of robust public transportation. When he moved to Washington, D.C. as an adult, he spent his new commute marveling at the workings of the subway. “It’s very fascinating, how complex it is, how diverse systems are around the world, and how important and often unappreciated these systems are to making our cities work efficiently,” he told Inverse.
And Dovak’s fascination doesn’t stop with D.C. or China either. His website features, among other things, a “Mini Metros” project with maps of subway systems from dozens of cities around the world.
Don’t Miss: These Maps Reveal the World’s Most Complex Subway Systems
