You can see American air pollution inequality from space
Satellite images reveal distinct boundaries in nitrous oxide pollution.

America's disparities in air pollution are dramatic enough to be seen from space.
Using data gathered by satellites and airplanes, researchers discovered rates of nitrous oxide (NO2) pollution vary significantly across neighborhoods in Houston, Texas. On average, NO2 pollution was 37 percent higher in non-white neighborhoods. This finding was published Wednesday in the journal Environmental Science & Technology.
This trend mirrors divides elsewhere in the United States, the research team says. They argue that new, high-resolution data from satellites can be used to inform policy on pollution.
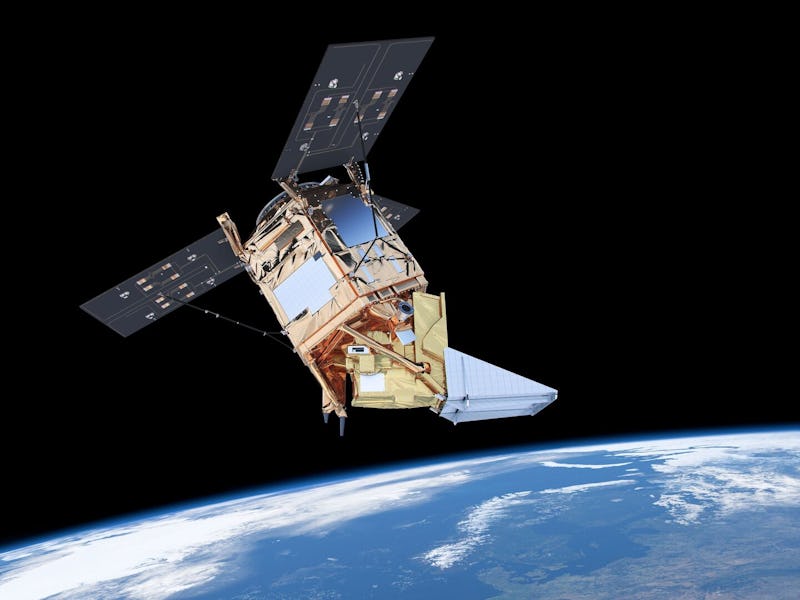
Led by researcher Angelique Demetillo, the team analyzed NO2 levels in high-res. The data was obtained from an airplane-mounted NASA spectrometer, which allowed them to view the situation at a neighborhood level. The team then compared that information to satellite data from the recently launched TROPOspheric Monitoring Instrument, which makes daily pollutant measurements.
Sally Pusede is an assistant professor of environmental science at the University of Virginia and the study's corresponding author. She tells Inverse that lack of small-scale observations like this has been a barrier for researchers aiming to quantify disparities in air pollution exposure.
New satellites that see higher spatial resolution aid that effort.
"These offer us a new opportunity to identify and address air pollution inequality through policymaking," Pusede says.
This study focuses on NO2, which comes from combustion — like that in car and truck engines, buses, and power plants. It can cause serious respiratory issues, including asthma, and prevent the body from fighting off infections.
NO2 isn't the only pollutant in our air — carbon monoxide and particulate matter can both cause health problems. But NO2 tends to be a good proxy for measuring air pollution on the whole, Pusede says. It helps that it's visible from space.
NO2 column densities were averaged to census tracts.
A worrying trend, seen from above — Houston is particularly susceptible to poor air quality; the city is a hub of petrochemical manufacturing. In 2019, the American Lung Association ranked Houston in the top 10 cities for ozone pollution. Ozone is created when NO2 reacts with other chemicals in the air.
Pusede and her colleagues calculated differences in NO2, weighted by population, across the Houston metropolitan area. In turn, they determined that differences in pollution are correlated with a neighborhood's race or ethnicity and income: The highest pollutant concentrations were in areas where low-income, non-white, and Hispanic people are living.
Proximity to industrial plants and diesel-burning vehicles are driving those trends.
This study confirms past research that shows local air pollution is not uniformly distributed in Houston, Texas. Instead, it is concentrated in certain areas, like those with higher rates of poverty.
"That's really a function of who lives closest to the sources," Pusede says. "Living near the sources is what's going to expose you to the highest levels for emissions like nitrogen oxides."
Houston represents bigger trends in America, Pusede says. Her team is working on "expanding this analysis to major cities across the United States."
She hopes that the work can be used to inform policy and evaluate the success of regulations aimed at reducing disparities.
"Without observations, it's difficult to say where air pollution is located and who's affected — and whether they're affected disproportionately," Pusede says. "So just having this observational evidence of a disparity, I think, is really critical."
Abstract: Houston, Texas is a major U.S. urban and industrial area where poor air quality is unevenly distributed and a disproportionate share is located in low-income, non-white, and Hispanic neighborhoods. We have traditionally lacked city-wide observations to fully describe these spatial heterogeneities in Houston and in cities globally, especially for reactive gases like nitrogen dioxide (NO2). Here, we analyze novel high-spatial-resolution (250 m × 500 m) NO2 vertical columns measured by the NASA GCAS airborne spectrometer as part of the September-2013 NASA DISCOVER-AQ mission and discuss differences in population-weighted NO2 at the census-tract level. Based on the average of 35 repeated flight circuits, we find 37 ± 6% higher NO2 for non-whites and Hispanics living in low-income tracts (LIN) compared to whites living in highincome tracts (HIW) and report NO2 disparities separately by race ethnicity (11−32%) and poverty status (15−28%). We observe substantial time-of-day and day-to-day variability in LIN-HIW NO2 differences (and in other metrics) driven by the greater prevalence of NOx (NO + NO2) emission sources in low-income, non-white, and Hispanic neighborhoods. We evaluate measurements from the recently launched satellite sensor TROPOMI (3.5 km × 7 km at nadir), averaged to 0.01° × 0.01° using physics-based oversampling, and demonstrate that TROPOMI resolves similar relative, but not absolute, tract-level differences compared to GCAS. We utilize the high-resolution FIVE and NEI NOx inventories, plus one year of TROPOMI weekday−weekend variability, to attribute tract-level NO2 disparities to industrial sources and heavy-duty diesel trucking. We show that GCAS and TROPOMI spatial patterns correspond to the surface patterns measured using aircraft profiling and surface monitors. We discuss opportunities for satellite remote sensing to inform decision making in cities generally.
This article was originally published on