Covid-19: Facebook wants your private data, but this time it's for a good reason
The social media giant is pairing with a top research university to track the spread.

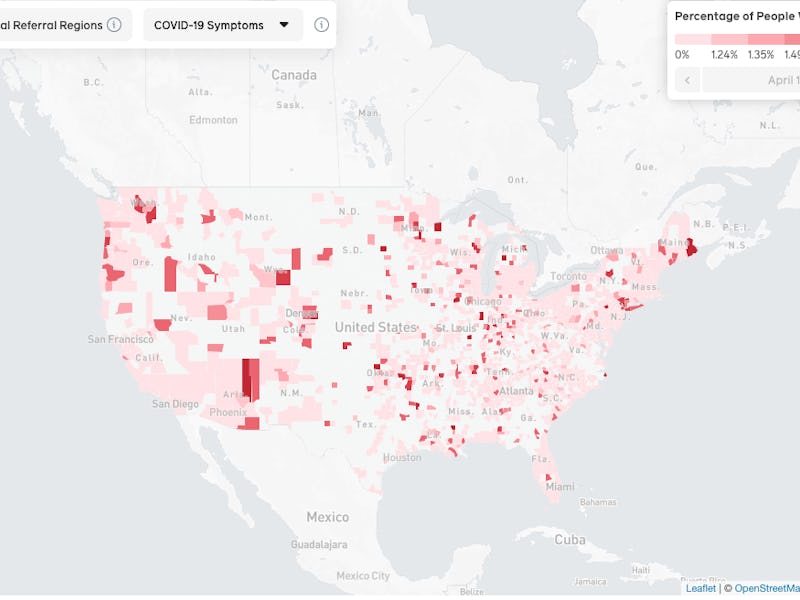
Facebook’s latest tool in the battle for information about the novel coronavirus is a map of America that tracks, county by county, the symptoms developed by those experiencing Covid-19. The project is being launched in conjunction with Carnegie Mellon, the second collaboration between the California tech giant and Pittsburgh research university this month.
The map, which can be found here, is incomplete. Based on data which Facebook and Carnegie Mellon began collecting earlier this month, has vast swaths listed with “Not enough people responded to show data,” ranging from Mendocino County in California to large areas of the Midwest. But given the challenge of attaining such data in the first place, Ryan Tibshirani, co-leader of Carnegie Mellon's Delphi COVID-19 Response Team, believes that the response is impressive nonetheless.
The Facebook-Carnegie Mellon map, as seen on April 20, 2020. The map reflects data from April 12, 2020.
A close up on Michigan, a coronavirus hotspot, as seen on Facebook's map on April 20, 2020.
For comparison, a map put out by the Detroit Health Department examining the region by zip code.
"I'm very happy with both the Facebook and Google survey results," said Tibshirani, associate professor of statistics and machine learning, in a press statement. "They both have exceeded my expectations." While no official numbers were released, the Carnegie Mellon press statement notes that "about one million responses per week" have completed the survey, which is presented as an opt-in option on Facebook, and "almost 600,000 users of the Google Opinion Rewards and AdMob apps were answering another CMU survey each day."
The map was unveiled by Facebook CEO Mark Zuckerberg in a post on the site.
“Understanding how Covid-19 is spreading is critical for local governments and public health officials as they allocate scarce resources like ventilators and PPE, and eventually to decide when it is safe to start re-opening different places. Researchers believe these symptom survey maps can be an important tool in making these decisions.”
Zuckerberg also added that “Facebook is uniquely suited to run these surveys because we serve a global community of billions of people and can do statistically accurate sampling.”
The social media giant is far from the only entity to publish maps tracking the spread of coronavirus throughout the United States. The New York Times uses data from a wide network of state and local health agencies to track coronavirus growth, while the Wall Street Journal has partnered with Johns Hopkins University to update the grim numbers on a daily basis. Local health organizations and media are also putting out their own site-specific maps.
The New York Times coronavirus map, as seen on April 20, 2020.
Any content put out by Facebook, of course, will have a greater range than any traditional media organization, all of whom use the site to publish their own content. As of 2019 there were approximately 180 million American Facebook users, while in the same year the New York Times saw its subscription rate rise to 4.7 million.
Carnegie Mellon's Delphi system was in place for tracking influenza for years, recognized by the Center for Disease control in 2019 as one of two National Centers of Excellence for Influenza Forecasting. Delphi uses two data points: one is called Crowdcast, which uses volunteers to make educated guesses about disease trends. The other is machine learning, which can recognize patterns in health care based on past experiences. While both of these systems are challenged by the novelty of coronavirus, "we believe that a diversity of data and approaches is our best weapon," Tibshirani says.
Beyond mere range, Facebook and Carnegie Mellon hope their map will be able to showcase the variety of symptoms that are seen within people who have developed Covid-19, one of the many mysteries that have befuddled doctors dealing with the disease. While there are some baselines like fever and coughing, Covid-19 positive patients have shown a multitude of symptoms ranging from seizures to kidney damage to heart failure. Covid-19 “can attack almost anything in the body with devastating consequences,” says cardiologist Harlan Krumholz of Yale University and Yale-New Haven Hospital, speaking to Science.
As of right now, the Facebook map only offers two vague options: “Covid-19 symptoms” and “flu symptoms.” But Zuckerberg is hopeful that as their dataset grows, their specificity will grow alongside it.
“The next step is to start running these surveys globally this week,” he writes. “This will allow us to expand the symptom maps to provide county-by-county data across almost every country in the world where Facebook operates.”
This article was originally published on