This Cognitive Map Reveals What We Really Think About the States of America
It goes way beyond North and South.

North/South isn’t the biggest divide in how we think of the United States, according to a new stereotyping study. That would be East/West; and after that, religious/atheist and conservative/liberal.
Researchers from the University of Cologne in Germany and Catholic University of Louvain in Belgium recruited more than 1,300 Americans to participate in online exercises meant to uncover how people group the lower 48 states. In one study, they asked participants to sort state names on a 2D-grid by putting similar ones closer together. To explain the groupings that emerged, the researchers asked another set of participants to rate the states for religiousness, political orientation, education, gun sentiment, newness, North/South orientation, and West/East orientation.
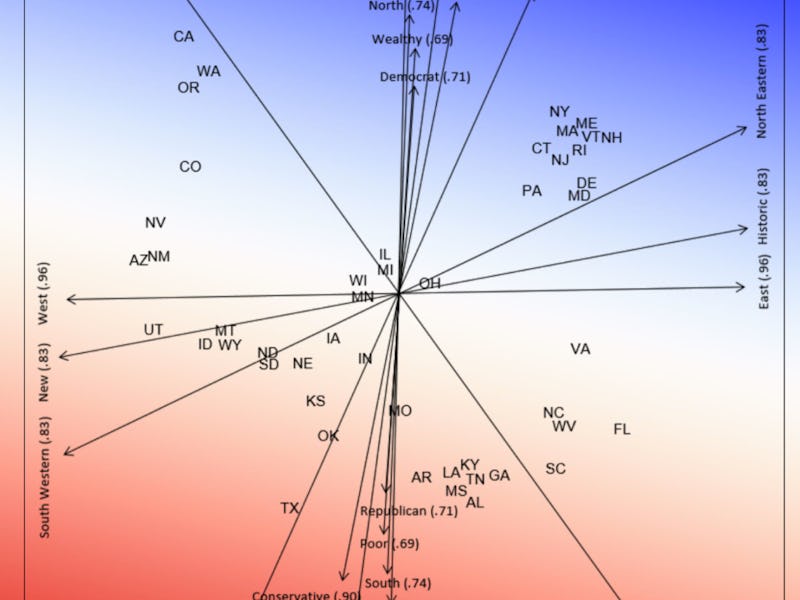
The resulting cognitive map shows some unusual clusters of states, dividing along both geographic and socioeconomic axes. Here’s one of those maps:
This cognitive map shows how we group different states — along with R-squared scores that show how well those groupings are explained by ratings along different dimensions.
East/West ratings were the strongest predictor of state groupings, with an R-squared score of .96 (1 is the highest, 0 is the lowest). Atheist/religious ratings were next, at .92, followed by conservative/liberal at .90.
One striking takeaway from the map is how much political stereotypes overlap with socioeconomic stereotypes, with wealthy, well-educated liberals on one side and poor, uneducated conservatives on the other.
Here’s a GIF showing how the U.S. geographical map compares to the cognitive map:
While states have always been categorized by geographical regions, time zones, and even political views, this cognitive map visualizes a deep-rooted divide in the United States. It is the divide we have all created in our minds. As the country continues to disagree on major political issues, the researchers hope that this map could “become a useful tool for explaining and predicting political and economic interstate relations” and help us bridge our differences.