These Two Maps Show How Americans Hurt Themselves Most
Some states have more in common than just their weather.

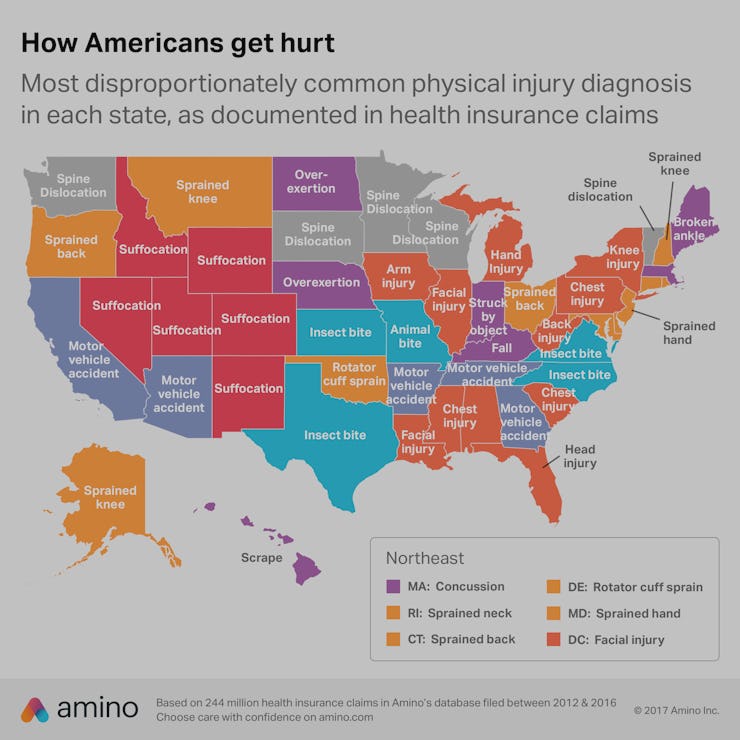
On Wednesday, insurance company Amino released maps detailing the most common injuries in all 50 states. For the rest, these maps provide a fascinating look at how Americans from different states tend to wind up at the doctor’s office.
Amino aggregates medical data, like insurance claims, to match patients up with an appropriate doctor. But that’s not all the information is good for. “Every time you go to the doctor, your diagnosis is recorded as a medical code,” Amino explains in a blog post on its site. “There’s a five digit number for everything from ‘insect bite’ to ‘animal-drawn vehicle accident.’ In the past year, nearly 1 out of every 6 patients in our database were diagnosed with a physical injury, so we thought it would be interesting to take a closer look.”
Coloradans need to get down from there this instant.
The first of Amino’s two maps displays the most common injuries across all states. There are so many different kinds of injuries that Amino says, “No single injury accounts for more than 7-8% of all diagnoses.” The collected data shows that the most common injuries don’t vary a lot across the country. Perhaps unsurprisingly, it’s cuts and bruises that are the most prevalent. Except for in Colorado, where falling is the most common physical injury.
More intriguing than the most common injuries, though, are those that are unique to different states. Or rather, as Amino puts it, the ones that are “disproportionately more or less common in each state, compared to the nation as whole.”
Spine dislocation? Suffocation? This got dark.
There’s a lot to parse through in this map, and some big divides in terms of the severity of injuries. Americans in Idaho, Nevada, New Mexico, Utah, Colorado, and Wyoming are apparently facing high numbers of suffocations. It should be noted, however, that Amino defines suffocation as “a broad category related to oxygen deficiency,” so it’s not as bad as what might immediately come to mind when one hears the word.
Meanwhile, states including Hawaii and Alaska have high numbers of injuries that sound less severe, like scrapes and sprained knees, respectively. Things that sound less severe, like scrapes in Hawaii and sprained knees in Alaska, are the most typical wounds.
Not included in the map are some other interesting finds. Amino notes that “‘Animal-drawn vehicle accident’ diagnoses are disproportionately common in five states: Idaho, Montana, Wyoming, North Dakota, and Nebraska.” There were actually 43,000 of them in the four-year period between 2012 and 2016. Meanwhile, “unarmed fights or brawls” seem to occur frequently in New York, more so than the other states. According to the company’s data, there were 295,797 injuries from these sorts of incidents nationwide and 35,000 occurred in New York. That’s over ten percent of those injuries.
Going state by state, there seems to be ample fodder for assumptions and stereotypes throughout this map. That Californians are getting in motor vehicle accidents or that Floridians have head injuries probably doesn’t come as a surprise. Still, if you can get past the surface-level silliness, that map does provide a rarely seen look at some of the more unpleasant realities of living in certain states across the country.