How a Programmer 3D-Printed the Ultimate Map of London Using LIDAR Data
Andrew Godwin made a 3D relief map of Central London using a 3D printer and a small bit of LIDAR data.

National governments release all kinds of official data online, but most people don’t make use of it. San Francisco-based programmer Andrew Godwin is not most people. He recently found a way to use the British government’s LIDAR data to create a scale model of a small slice of Central London, the city where he grew up.
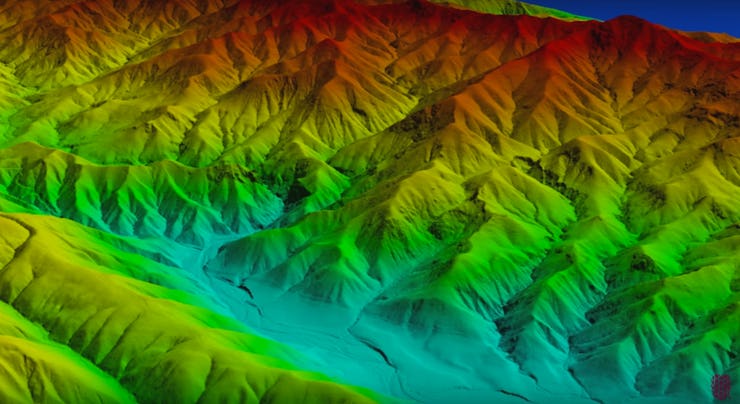
LIDAR, or Light Detection and Ranging, is a surveying technology that measures distance by using lasers and has applications in map-making as well as other scientific umbrellas like seismology and geology. Godwin got the idea for his map called “London Rising” when he learned through Twitter that the UK Environment Agency had begun releasing LIDAR data of London’s landscape. Searching for innovative ways to use the 3D printer he had recently purchased, Godwin discerned he could transform the raw data into a 3D map with actual vertical relief.
He ran into the project’s first major obstacle when he began converting the raw LIDAR data into a printable STL file that the 3D printer could read. Godwin relied on some basic geometry to convert the cloud of data points into a 3D model, but refining its jagged edges into a smoother model required some feature extraction skills that Godwin doesn’t possess. “I just took all the data, averaged out points to make a lower-detail heightmap, snapped the heights to 3m intervals and applied neighbour-based smoothing to the whole thing,” Godwin writes in his detailed blog post about the project.
Once Godwin had created his 200MB STL file, he endured countless hours of trial and error as he tweaked various settings on the 3D printer, changing the plastic material he was using, the heat of the nozzle, and the flow rate of the plastic. “The first 20 tiles came out with various defects or often the buildings would be blobby or strings of plastic would be left on the model,” Godwin says. Even though the first versions Godwin printed were stringy messes, there was enough evidence after each print to suggest he was on the right track. That sense of progress kept him going.
The LIDAR data in QGIS, a desktop geographic information system application
On top of fine-tuning the 3D printer to achieve a clean tile, it takes a few hours for the printer to perform each print. That means even if Godwin made a minor tweak in the temperature of the nozzle or the amount of plastic being squeezed out, he would potentially have to wait four hours just to see that this particular refinement had failed. Trying out a few different variations of printer settings could potentially take up an entire day, which is why persistence (and having other stuff to do in the meantime) became a critical part of the process.
Close up of one of 48 tiles
Although there is enough LIDAR data to potentially map out all of London, Godwin chose to recreate a specific slice of Central London due to the well-known landmarks it contains and a small concentration of tall buildings that would add some dramatic height to his map. Stretching along the Thames from Hyde Park in the west to Godwin’s old apartment in the Royal Docks in the east, the area covered by the map required that Godwin print 48 square tiles 7.5 cm on each side to produce the finished map, which is approximately 3 feet by one foot. With 48 tiles that took anywhere from one to four hours to print, compounded by hours of technical difficulties with the 3D printer, you can begin to understand the kind of dedication that was required to see this project through.
The map coming finally coming together
Following the well-earned success of the map of London, Godwin plans to apply his conversion of LIDAR data to 3D relief maps to other cities around the globe. Perhaps his new home base San Francisco will be the subject of his next attempt, as he’s already begun collecting LIDAR data of San Francisco’s peninsula from the USGS. The map of London that hangs above his desk serves as a reminder that a lot is possible with a little bit of data, a 3D printer, and a surplus of perseverance and patience.
The finished map hanging on Godwin's wall