Find Your House With NASA's Help Using ASTER's 2.95 Million Space Photos
The images from a satellite-borne, all-seeing eye are suddenly available to the public.

For about 16 years, NASA and Japan have been operating the Advanced Spaceborne Thermal Emission and Reflection Radiometer instrument, aka ASTER. Created by Japan and installed onboard NASA’s Terra satellite currently orbiting Earth, ASTER is essentially a very powerful camera and it has taken a lot of photos, some 2.95 million individual scenes of the planet, to be precise. Among those photos are images of the aftermath of floods in Asia and the incredible destruction wrought by wildfires in California. Until now, only the topographic maps of Earth were available to the public for free. Any other ASTER data products required a fee to be paid to Japan’s Ministry of Economy, Trade, and Industry.
That’s no longer the case. The Japanese government and NASA have decided to continue operating the instrument on Terra and make the trove of detailed surface maps of the planet accessible to anyone, at no cost.
The new change won’t simply make it easier for researchers looking to study the Earth using a wide variety of topographical data, but could also allow citizen scientists and students to engage more easily with the science and data behind Earth’s geography, surface temperatures, elevation, and other features. This is particularly important to those interested in environmental trends related to pollution, wetland loss, and coral reef degradation — but can’t afford expensive subscriptions to essential datasets.
“We anticipate a dramatic increase in the number of users of our data, with new and exciting results to come,” said Michael Abrams, ASTER science team leader at NASA’s Jet Propulsion Laboratory in Pasadena, California, in a statement.
Think of ASTER as a multimodal version of Google Earth. Both allow you to take a look at various parts of the globe as depicted from space. With ASTER, however, you can apply various types of filters to get a much better sense of what is going on from a scientific perspective. Those include better representations of changes in elevation, temperatures, environmental phenomena, and much more.
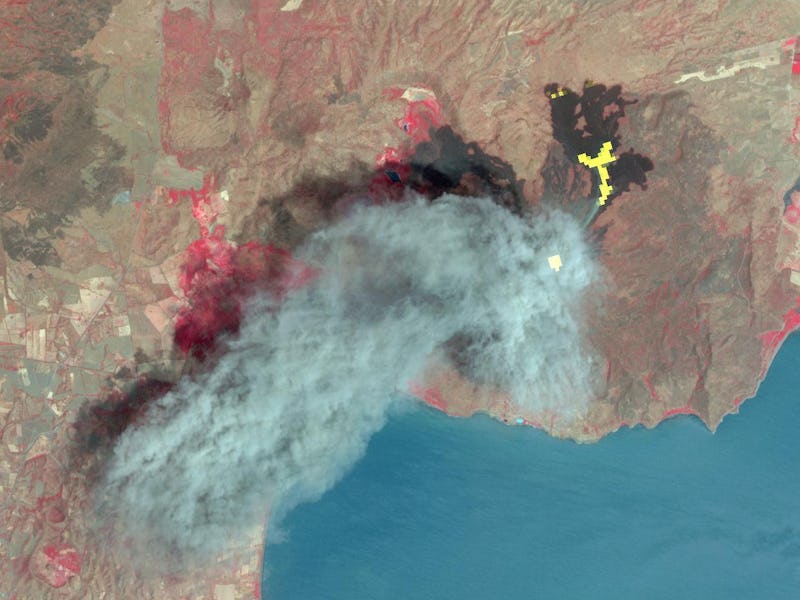
For example, the image above captures the March 2016 eruption of Nicaragua’s Momotombo volcano, in both visible and thermal infrared bands. The ash plume is the blue-gray stuff, while the thermal infrared bands illustrate lava flows in yellow. The summit crater of the volcano is highlighted in white, and vegetation around the area is shown in red.
At a maximum resolution ranging from about 15 to 90 meters, ASTER is pretty comparable to what you might try to do with Google Earth (i.e. finding your house on a map, like every other bored soul on the interwebs). And the dataset covers about 99 percent of Earth’s landmass.
If your computer is up to date, you can take various ASTER-powered tools for a spin and see for yourself what kind of weird stuff is happening on the planet. The dataset goes back to 1999, so feel free to go back and see what your neighborhood was like when Spongebob Squarepants had just debuted, AOL was a thing, and the Cleveland Browns were still losers (actually scratch the last one — they still are.) In fact you might just see a clearer view of China before it became blanketed in smog.